Vineyards and wineries for sale in Italy
Are you looking to buy a vineyard in Italy?
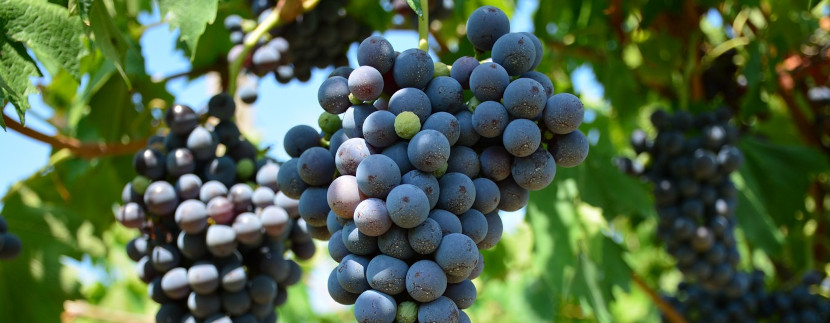
Year in and year out Italy is one of the leading wine producers in the world. From the whites of Spumante, Prosecco and Soave to the reds of Barbera, Sangiovese and Lambrusco, Italy has a wine for every dish and occasion.
You might be looking for an intimate vineyard and winery to get started. You might be looking for commercial scale operations to add to your existing production. In either case, we are here to help you with our portfolio of vineyards for sale and our scouting activity.
Just let us know your needs today.
Vineyards & Wineries for sale in Italy
- Tuscany
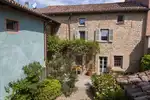
- Campiglia Marittima (LI): 17 hectares of vines, 5 hectares olives, approx 35 hectares total. Local reds & Vermentino. Includes majestic Villa. · Average production 75,000 bottles/year; capacity is higher
- Veneto
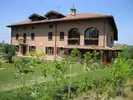
- Valpolicella, Verona: 50 hectares of vines + buildings
- Multiple regions
- Winemaker with vines distributed in northern and central Italy: 145 hectares of vines in Tuscany, 60 hectares in Lombardia, 53 hectares in the Veneto, etc. for a total of 313 hectares.
Italy's vines and wines, in numbers
Perhaps you're also interested in general information about the wine sector in Italy? The following enological statistics aim to quench your thirst!
Average vineyard size
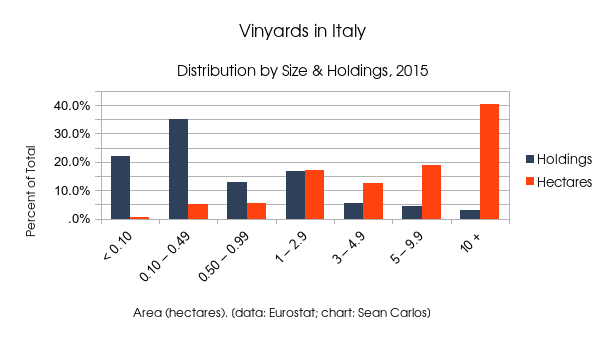
Total area under vines (in/not yet in production), 2015
| Area (ha) | Hectares | Holdings | %Total Hectares | % Total Holdings |
|---|---|---|---|---|
| < 0.10 | 3,923 | 84,267 | 0.6% | 22.1% |
| 0.10 to 0.49 | 33,021 | 133,689 | 5.1% | 35.1% |
| 0.50 to 0.99 | 35,481 | 49,707 | 5.5% | 13.0% |
| 1 to 2.9 | 112,090 | 63,291 | 17.2% | 16.6% |
| 3 to 4.9 | 80,842 | 20,778 | 12.4% | 5.5% |
| 5 to 9.9 | 123,463 | 17,685 | 19.0% | 4.6% |
| 10 ha + | 261,869 | 11,724 | 40.2% | 3.1% |
| Total | 650,690 | 381,141 | ||
| Source: Eurostat | ||||
Average wine grape vines in production by region, 2015
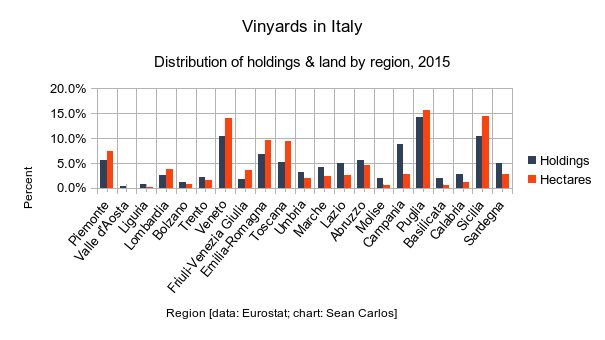
| Region | Hectares | Holdings | Average ha/holding |
|---|---|---|---|
| Piemonte | 46,899 | 19,843 | 2.4 |
| Valle d'Aosta | 427 | 1,301 | 0.3 |
| Liguria | 1,027 | 2,451 | 0.4 |
| Lombardia | 24,264 | 9,380 | 2.6 |
| Bolzano | 5,070 | 4,005 | 1.3 |
| Trento | 10,276 | 7,562 | 1.4 |
| Veneto | 89,149 | 36,818 | 2.4 |
| Friuli-Venezia Giulia | 22,256 | 6,687 | 3.3 |
| Emilia-Romagna | 61,471 | 24,480 | 2.5 |
| Toscana | 59,325 | 18,455 | 3.2 |
| Umbria | 11,988 | 11,525 | 1.0 |
| Marche | 15,174 | 14,601 | 1.0 |
| Lazio | 15,752 | 17,409 | 0.9 |
| Abruzzo | 28,624 | 19,969 | 1.4 |
| Molise | 4,276 | 6,885 | 0.6 |
| Campania | 18,057 | 31,354 | 0.6 |
| Puglia | 99,531 | 50,546 | 2.0 |
| Basilicata | 3,882 | 7,301 | 0.5 |
| Calabria | 6,960 | 9,772 | 0.7 |
| Sicilia | 91,755 | 37,324 | 2.5 |
| Sardegna | 18,259 | 18,064 | 1.0 |
| Total | 634,422 | 355,732 | 1.8 |
| Source: Eurostat | |||
Annual wine production volume, Hectoliters, 2017
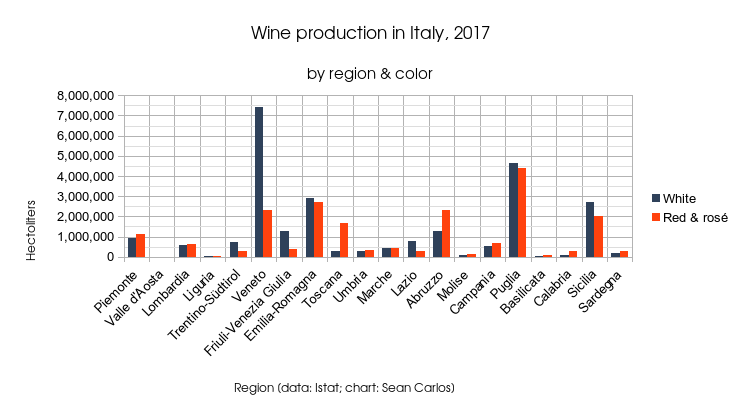
| Region | White | Red & rosé |
|---|---|---|
| Piemonte | 938,233 | 1,104,397 |
| Valle d'Aosta | 6,000 | 7,100 |
| Lombardia | 584,726 | 617,041 |
| Liguria | 44,769 | 21,851 |
| Trentino-Südtirol | 725,355 | 304,014 |
| Veneto | 7,419,933 | 2,301,122 |
| Friuli-Venezia Giulia | 1,265,779 | 373,281 |
| Emilia-Romagna | 2,929,401 | 2,716,641 |
| Toscana | 270,146 | 1,674,205 |
| Umbria | 307,436 | 336,930 |
| Marche | 450,850 | 408,658 |
| Lazio | 779,256 | 281,684 |
| Abruzzo | 1,279,782 | 2,324,711 |
| Molise | 90,370 | 157,488 |
| Campania | 552,321 | 660,813 |
| Puglia | 4,663,803 | 4,379,099 |
| Basilicata | 15,788 | 75,192 |
| Calabria | 101,479 | 262,979 |
| Sicilia | 2,735,723 | 2,019,054 |
| Sardegna | 179,328 | 263,393 |
| Totals | 25,340,478 | 20,289,653 |
| Source: Istat | ||
Annual production by variety
Area and number of vineyards, 2015
| Vine Variety | Color | Hectares | Holdings | %Hectares of same color | %Holdings of same color |
|---|---|---|---|---|---|
| Aglianico | R | 7,671 | 20,376 | 2.2% | 8.1% |
| Aglianico del Vulture | R | 2,202 | 3,165 | 0.6% | 1.3% |
| Albana | W | 793 | 1,532 | 0.3% | 0.7% |
| Ancellotta | R | 1,787 | 1,663 | 0.5% | 0.7% |
| Ansonica | W | 5,092 | 4,707 | 1.8% | 2.3% |
| Arneis | W | 1,180 | 915 | 0.4% | 0.4% |
| Barbera nera | R | 15,740 | 19,968 | 4.6% | 7.9% |
| Biancame | W | 955 | 3,847 | 0.3% | 1.9% |
| Bombino bianco | W | 1,178 | 1,655 | 0.4% | 0.8% |
| Bombino nero | R | 882 | 1,854 | 0.3% | 0.7% |
| Bonarda piemontese | R | 6,084 | 5,455 | 1.8% | 2.2% |
| Brachetto | R | 1,716 | 2,145 | 0.5% | 0.8% |
| Cabernet franc | R | 5,803 | 8,144 | 1.7% | 3.2% |
| Cabernet Sauvignon | R | 14,375 | 16,179 | 4.2% | 6.4% |
| Calabrese | R | 14,707 | 10,297 | 4.3% | 4.1% |
| Canaiolo nero | R | 1,008 | 6,717 | 0.3% | 2.7% |
| Carignan noir | R | 1,684 | 2,050 | 0.5% | 0.8% |
| Catarratto bianco comune | W | 18,768 | 14,282 | 6.8% | 6.9% |
| Catarratto bianco lucido | W | 12,538 | 5,731 | 4.5% | 2.8% |
| Chardonnay blanc | W | 18,244 | 14,338 | 6.6% | 6.9% |
| Ciliegiolo | R | 858 | 5,229 | 0.3% | 2.1% |
| Cococciola | W | 1,793 | 1,701 | 0.6% | 0.8% |
| Cortese | W | 2,478 | 1,593 | 0.9% | 0.8% |
| Corvina | R | 6,619 | 3,483 | 1.9% | 1.4% |
| Corvinone | R | 1,177 | 1,934 | 0.3% | 0.8% |
| Dolcetto | R | 4,549 | 5,182 | 1.3% | 2.0% |
| Falanghina flegrea | W | 3,994 | 5,492 | 1.4% | 2.6% |
| Fiano | W | 2,336 | 2,034 | 0.8% | 1.0% |
| Frappato di vittoria | R | 605 | 511 | 0.2% | 0.2% |
| Freisa | R | 531 | 1,513 | 0.2% | 0.6% |
| Friulano | W | 2,603 | 4,287 | 0.9% | 2.1% |
| Gaglioppo | R | 4,837 | 6,601 | 1.4% | 2.6% |
| Garganega | W | 5,545 | 4,118 | 2.0% | 2.0% |
| Garnacha tinta | R | 5,537 | 6,709 | 1.6% | 2.7% |
| Gewürztraminer | O | 1,121 | 1,759 | 5.41% | 18.08% |
| Grecanico dorato | W | 3,454 | 3,580 | 1.2% | 1.7% |
| Grechetto bianco | W | 1,877 | 3,757 | 0.7% | 1.8% |
| Greco bianco | W | 2,105 | 2,581 | 0.8% | 1.2% |
| Grignolino | R | 959 | 995 | 0.3% | 0.4% |
| Grillo | W | 7,996 | 5,968 | 2.9% | 2.9% |
| Lambrusco di Sorbara | R | 895 | 567 | 0.3% | 0.2% |
| Lambrusco Grasparossa | R | 902 | 743 | 0.3% | 0.3% |
| Lambrusco Maestri | R | 5,956 | 5,877 | 1.7% | 2.3% |
| Lambrusco Salamino | R | 6,525 | 4,084 | 1.9% | 1.6% |
| Magliocco canino | R | 716 | 1,203 | 0.2% | 0.5% |
| Malvasia bianca | W | 2,181 | 5,132 | 0.8% | 2.5% |
| Malvasia bianca di Candia | W | 6,983 | 16,228 | 2.5% | 7.8% |
| Malvasia bianca lunga | W | 1,135 | 9,573 | 0.4% | 4.6% |
| Malvasia del Lazio | W | 676 | 1,852 | 0.2% | 0.9% |
| Malvasia di Candia aromatica | W | 1,091 | 1,519 | 0.4% | 0.7% |
| Malvasia nera di Brindisi | R | 1,149 | 1,894 | 0.3% | 0.7% |
| Merlot noir | R | 24,111 | 33,252 | 7.1% | 13.1% |
| Monica nera | R | 1,233 | 3,196 | 0.4% | 1.3% |
| Montepulciano | R | 33,797 | 39,021 | 9.9% | 15.4% |
| Moscato giallo | W | 732 | 1,209 | 0.3% | 0.6% |
| Müller Thurgau Weiss | W | 613 | 936 | 0.2% | 0.5% |
| Muscat a petits grains blancs | W | 14,241 | 9,639 | 5.1% | 4.6% |
| Muscat of Alexandria | W | 1,538 | 1,678 | 0.6% | 0.8% |
| Nebbiolo | R | 7,898 | 7,453 | 2.3% | 2.9% |
| Negro amaro | R | 12,088 | 11,336 | 3.5% | 4.5% |
| Nerello Mascalese | R | 1,870 | 2,485 | 0.5% | 1.0% |
| Nuragus | W | 1,035 | 2,583 | 0.4% | 1.2% |
| Ortrugo | W | 740 | 988 | 0.3% | 0.5% |
| Passerina | W | 1,178 | 1,664 | 0.4% | 0.8% |
| Pecorino | W | 1,825 | 2,233 | 0.7% | 1.1% |
| Piedirosso | R | 598 | 2,791 | 0.2% | 1.1% |
| Pignoletto | W | 1,120 | 947 | 0.4% | 0.5% |
| Pinot blanc | W | 2,428 | 4,192 | 0.9% | 2.0% |
| Pinot gris | O | 19,589 | 8,600 | 94.59% | 88.40% |
| Pinot noir | R | 5,197 | 3,842 | 1.5% | 1.5% |
| Primitivo | R | 15,592 | 10,802 | 4.6% | 4.3% |
| Raboso Piave | R | 655 | 940 | 0.2% | 0.4% |
| Refosco dal peduncolo rosso | R | 1,291 | 1,752 | 0.4% | 0.7% |
| Riesling Weiss | W | 1,547 | 2,173 | 0.6% | 1.0% |
| Rondinella | R | 2,630 | 3,518 | 0.8% | 1.4% |
| Sagrantino | R | 999 | 930 | 0.3% | 0.4% |
| Sangiovese | R | 71,482 | 58,347 | 20.9% | 23.1% |
| Sauvignon blanc | W | 4,047 | 4,584 | 1.5% | 2.2% |
| Schiava lombarda | R | 712 | 1,613 | 0.2% | 0.6% |
| Syrah | R | 7,962 | 5,933 | 2.3% | 2.3% |
| Trebbiano abruzzese | W | 2,478 | 5,714 | 0.9% | 2.8% |
| Trebbiano giallo | W | 878 | 3,114 | 0.3% | 1.5% |
| Trebbiano romagnolo | W | 19,716 | 11,095 | 7.1% | 5.3% |
| Trebbiano toscano | W | 37,709 | 56,598 | 13.6% | 27.3% |
| Uva di Troia | R | 2,692 | 2,581 | 0.8% | 1.0% |
| Verdeca | W | 933 | 2,824 | 0.3% | 1.4% |
| Verdicchio bianco | W | 1,667 | 527 | 0.6% | 0.3% |
| Verduzzo friulano | W | 693 | 1,919 | 0.3% | 0.9% |
| Verduzzo trevigiano | W | 544 | 972 | 0.2% | 0.5% |
| Vermentino | W | 7,182 | 8,059 | 2.6% | 3.9% |
| Vernaccia di San Gimignano | W | 936 | 427 | 0.3% | 0.2% |
| Viognier | W | 1,960 | 1,384 | 0.7% | 0.7% |
| Welschriesling | W | 1,283 | 1,354 | 0.5% | 0.7% |
| Other main red grape varieties | R | 35,041 | 46,064 | 10.3% | 18.2% |
| Other main white mixed grape varieties | W | 61,265 | 57,679 | 22.1% | 27.8% |
| Total main other different colour grape varieties | O | 20,709 | 9,728 | ||
| Total main red grape varieties | R | 341,322 | 253,044 | ||
| Total main white grape varieties | W | 276,653 | 207,552 | ||
| Total main grape varieties | 638,684 | 353,142 | |||
| Source: Eurostat | |||||

 3
3